Plotting the Collatz sequences in polar coordinates, part 2
On January 30, I posted an observation that plotting Collatz sequences in polar coordinates produces a cardioid and nephroid. I didn’t have an underlying intuition as to why.
I posted the findings and the question as to why over at Mathematics Stack Exchange:
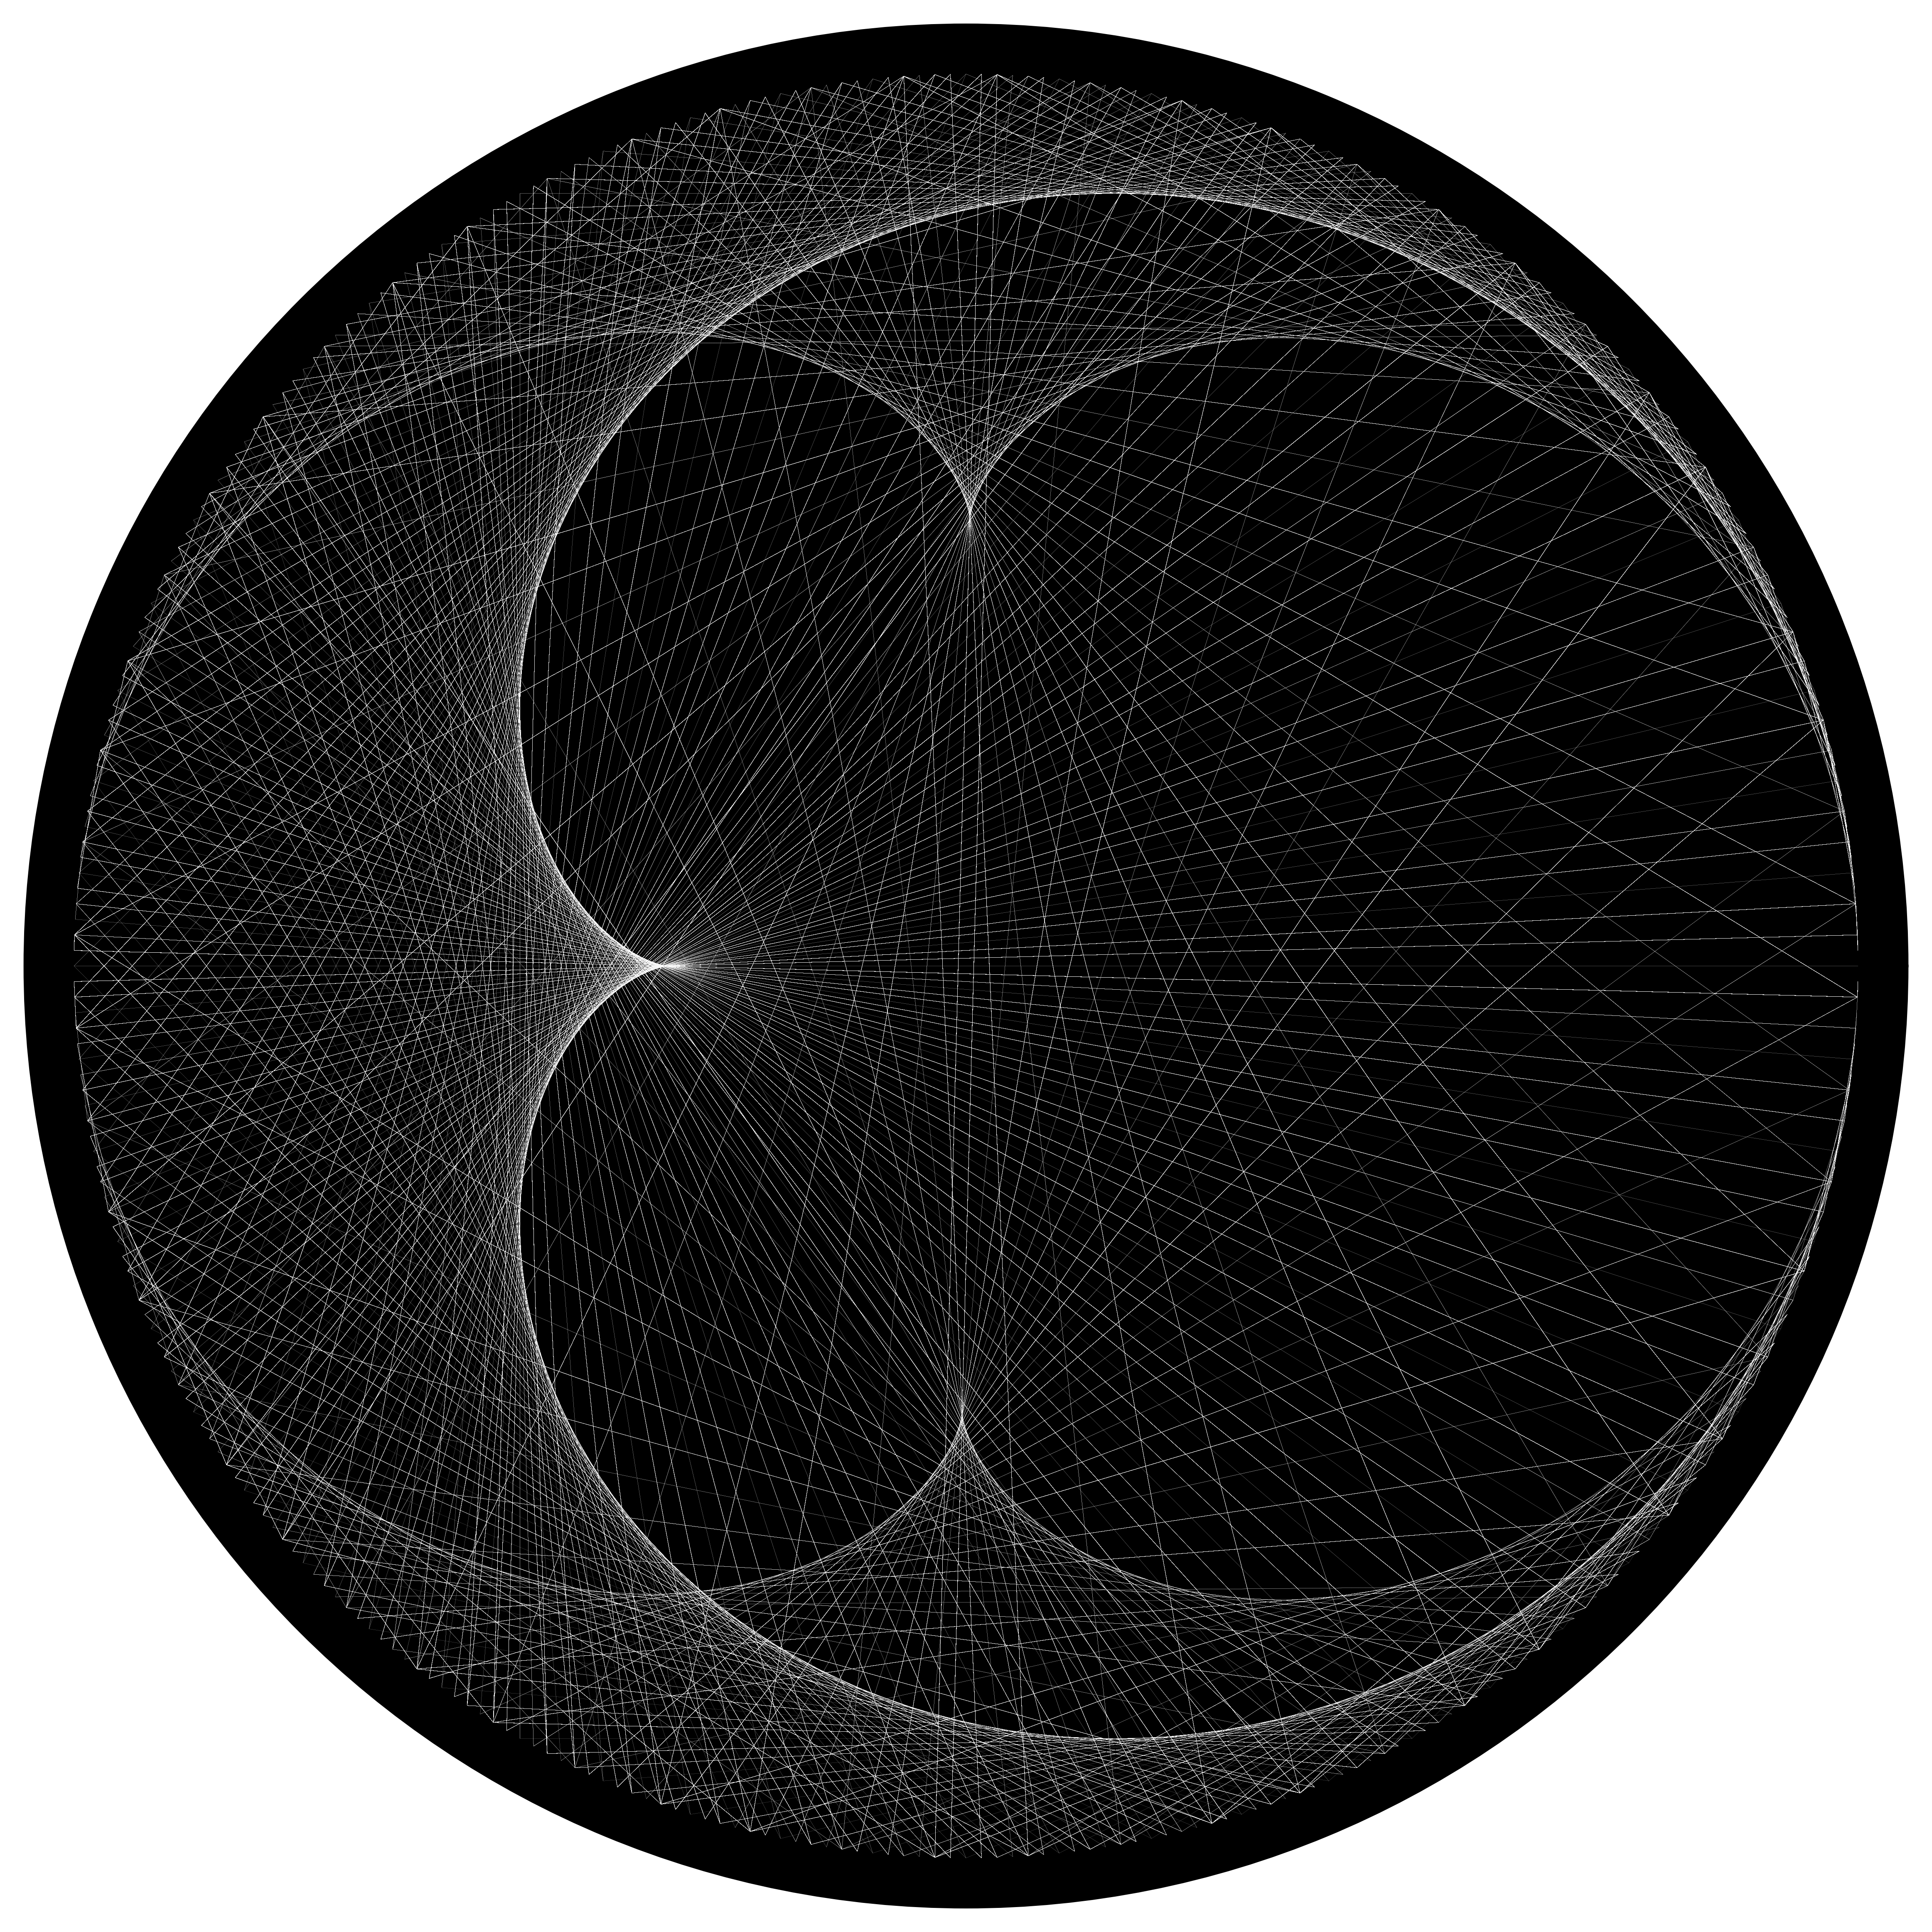
I generated the Collatz sequences for the first 2,000 starting integers, and plotted these sequences “on top of each other” in polar coordinates, using a fixed radius and with each element in the sequence as theta (converted to radians, i.e., modulo 360). Successive elements within each sequence are connected by (semi-transparent) lines.
Following these steps produced the image below, where we can clearly see two shapes (a cardioid and nephroid). (The Python code that generates this image is available here. The total number of elements in the 2,000 sequences is 136,100, so the total number of lines plotted in the image below is 136,100 - 2,000 = 134,100.)
My question is: Why do a cardioid and nephroid clearly appear? Is there something notable about the Collatz sequences that produce these shapes, or is this unrelated to the intricacies of the Collatz sequences, and that other unrelated integer sequences also produce similar shapes?
The question got some interest from the group. My synthesis from the discussion is that the cardioid can be generated based on the envelope of lines drawn between points around a circle, with each line drawn between point line between points n and 2n (mod N), as described here. The nephroid is based on the same concept for points between n and 3n, as described here. The Collatz sequence contains both behaviors: some elements in sequence follow 2n->n (the order of the two doesn’t matter if we are connecting lines), and some elements follow n->3n+1 (but the +1 component is negligible for the overall shape), resulting in the cardioid and nephroid.
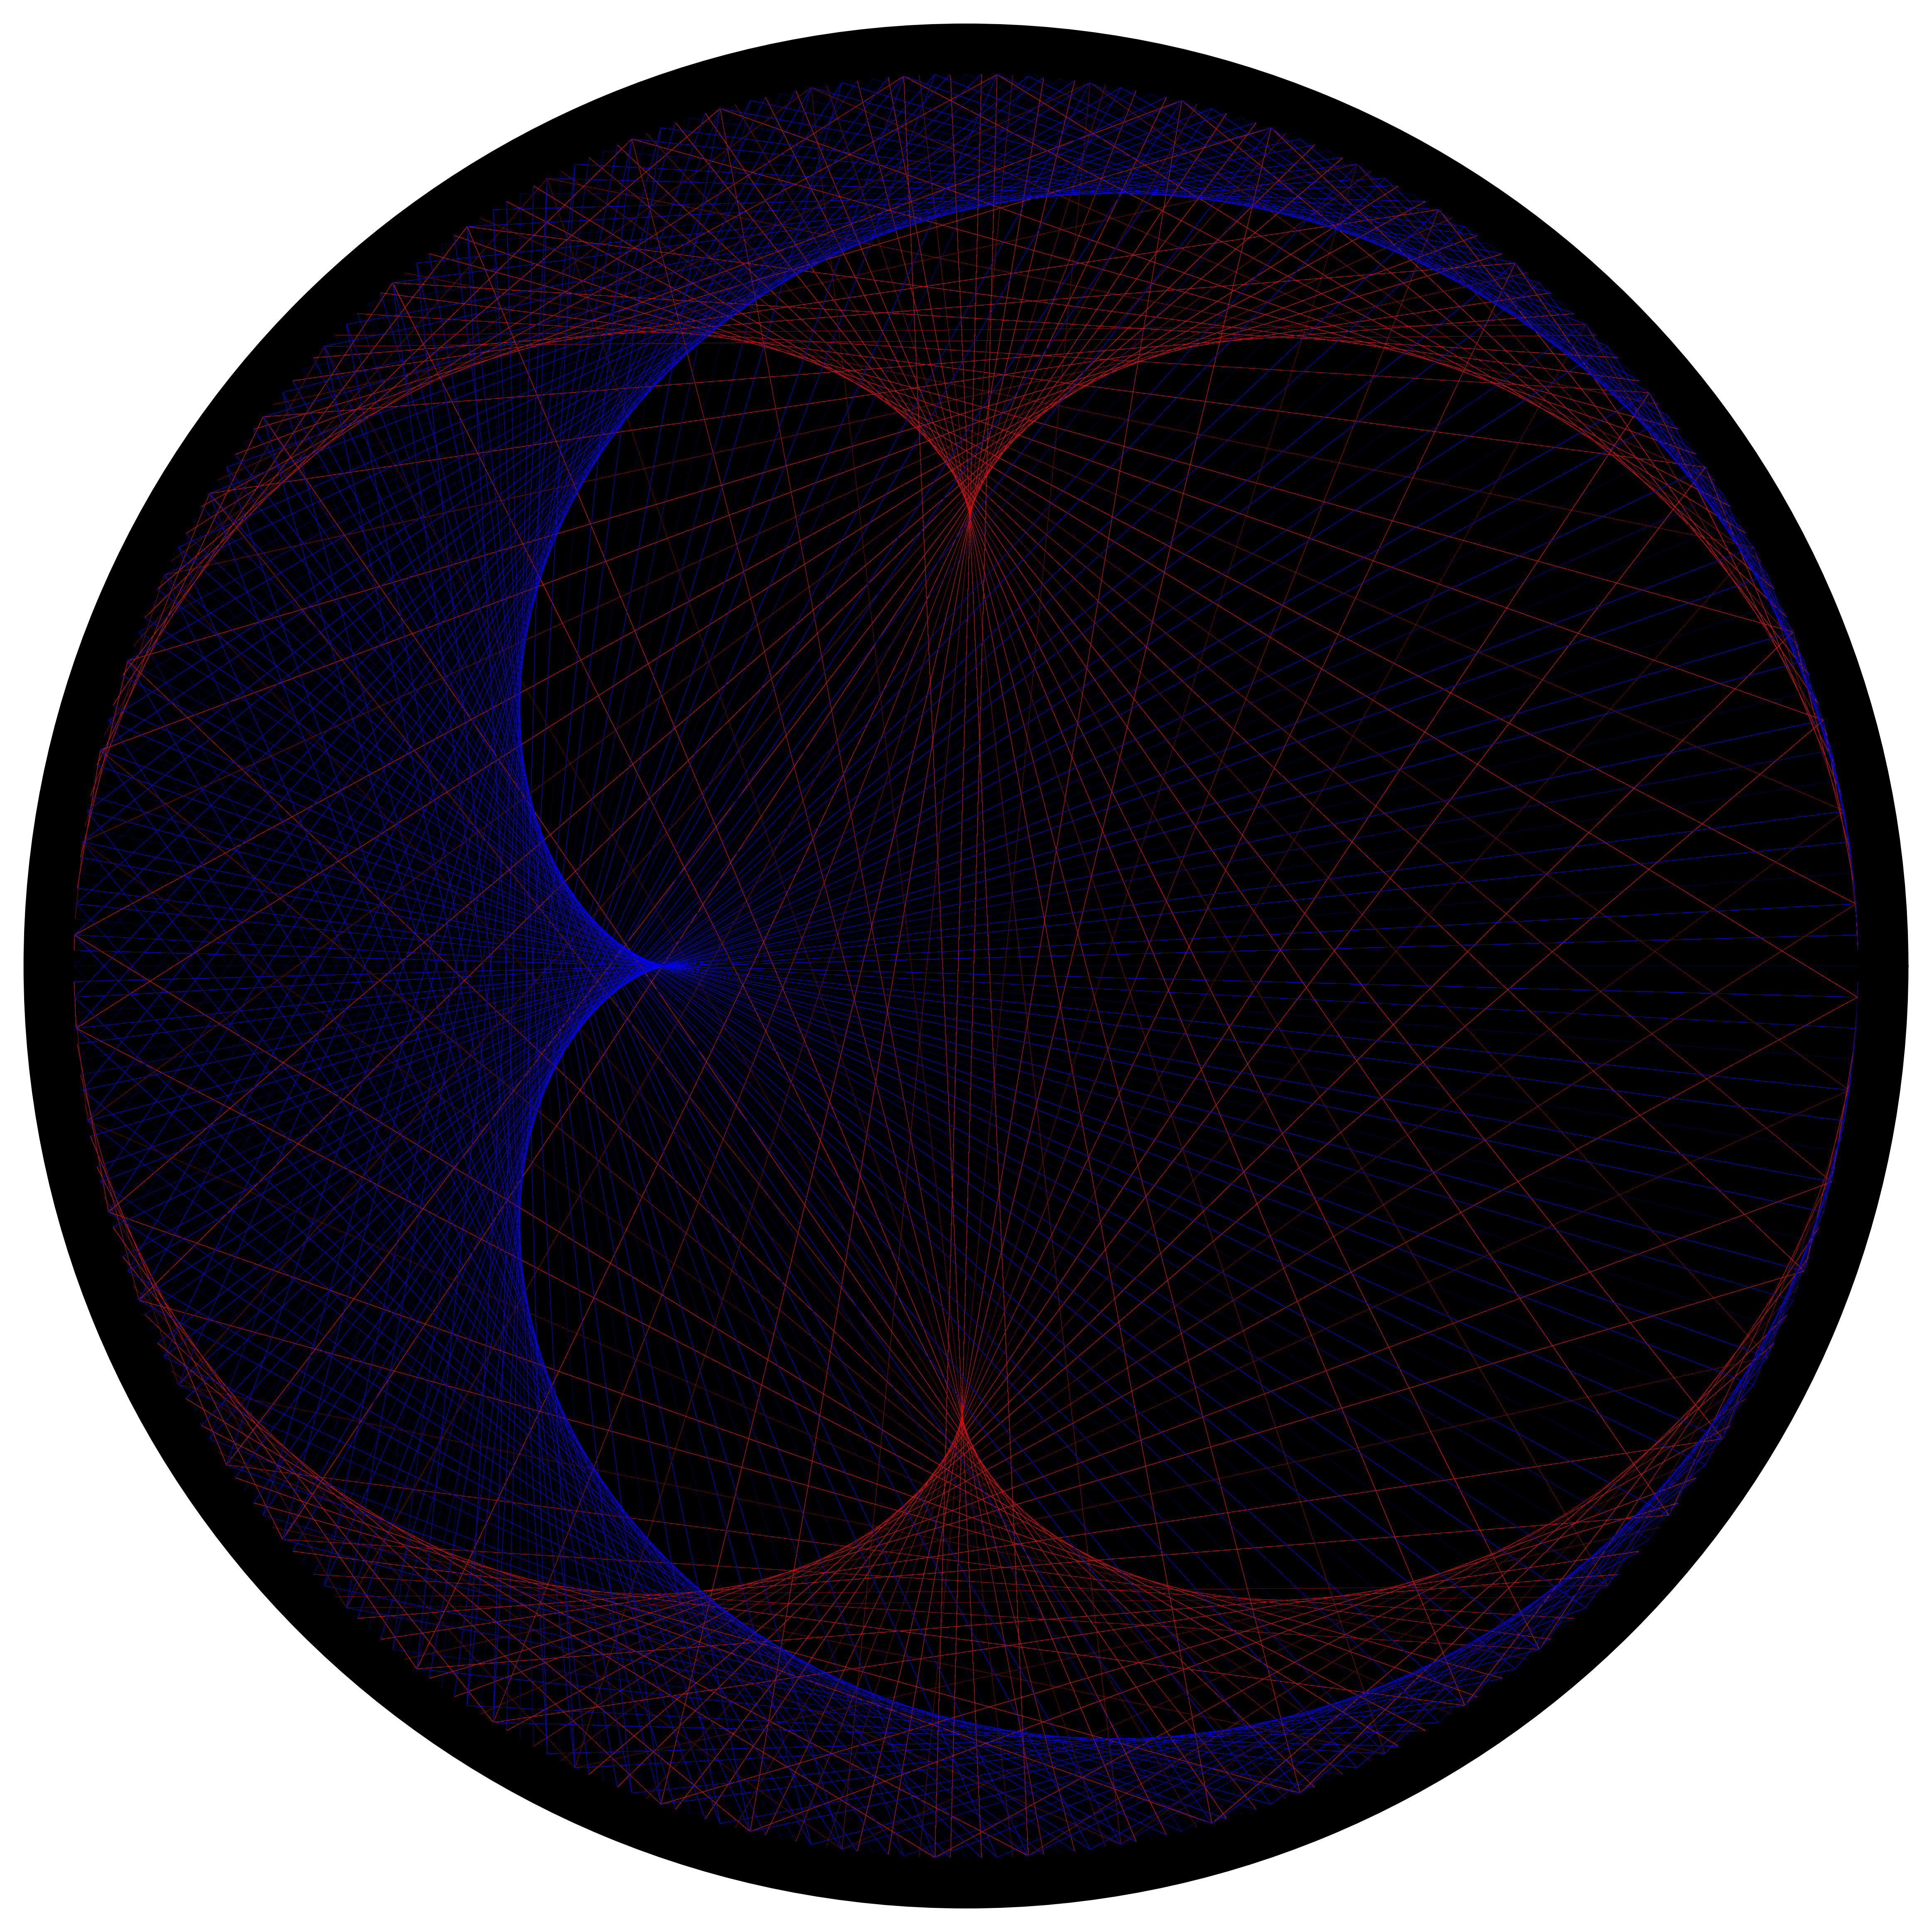
One commenter suggested redrawing the image where for each line connecting terms (N,N+1) in a sequence, the line is red if N+1 > N and blue if N+1 < N, and I did so. From this we can clearly see that the nephroid is red and the cardioid is blue, highlighting the behavior above.