
Technical construction of cohort retention metrics for consumer products
Cohort retention metrics are critical to evaluate product-market fit in consumer tech. If a product is satisfying user needs in the relevant market, retention metrics will reflect that users continually return to the product over time.
Accordingly, correct technical construction of retention metrics is a necessary condition to both correctly assess product-market fit and identify insights that improve the business. Cutting retention data by variables like demographics, traffic source, or other custom user segments will show if there’s a particular group of users that are retaining better over time, which can be used to inform subsequent product and marketing decisions.
There are many retention curves available online, some for real products (like Netflix) but most as an example. When example retention curves are posted, I’ve often found that the y-axis is usually labeled nondescriptly as “Retention,” often without further explanation for how it’s calculated. But proper construction of these metrics is far from obvious. Making the wrong technical design choices can risk misinterpretation leading to incorrect choices for the product and business.
This post is intended for Product Managers, Product Analysts, Engineers as a guide to constructing retention metrics.
Why cohorts?
Before moving on to constructing cohort retention metrics, first a note on why products generally look at cohort retention as opposed to non-cohort-based retention metrics.
A cohort-based metric groups users into a time-based cohort and tracks how these users retain over a subsequent period. Any user who meets a cohort entry condition (more on this later) for a given period of time becomes a cohort member — for instance we might define cohorts by “July 2021” or “Week 35” based on their registration month or week, respectively.
This cohort enables comparative analysis between groups of users over time, for evidence of increasing or decreasing retention (and product-market fit). We can contrast this with a non-cohort-based retention metric, such as “percent of currently active users who remain active over next N days.” The reason the latter is nonstandard is because it does not allow us to compare groups of users over time who are in similar stages of their product lifecycle. Cohort views let us look at, for example, the August 2021 cohort in comparison to the July 2021 cohort 60 days after registration, for evidence of improved retention.The problem with looking for the same increase with a “rolling,” non-cohort-based retention metric is that all users are thrown together in one number without controlling for the stage of the user lifecycle. If you increased your marketing spend and drove more signups, you might see retention decreasing just by mix-shifts in the user population, even if retention for new users on a cohort basis remained flat.
Constructing a cohort retention metric
A cohort retention metric requires choosing five parameters:
- The trigger action
- The retention action
- The evaluation date
- The evaluation window
- The trigger date grouping
We’ll discuss each of these in turn:
The trigger action is an action a user takes that will include them in a cohort for retention analysis. Example trigger actions include “registration” or “first purchase” (for ecommerce) — after the user does this action, we want to see how they retain over time. The number of users who execute a trigger action in a given time period is the denominator of retention for that cohort. Typically (but not always), users can only do a trigger action once, such that each date cohort contains strictly non-overlapping groups of users.
The retention action is an action a user takes that will mark them as retained. Users must be a member of a cohort to have a retention action. Example retention actions include “new session,” “app open,” “subscription renewal,” or “purchase.” You might choose this action to reflect use of the overall product or a particular feature, whatever you are trying to measure. The number of users who execute a retention action is the numerator of retention for that cohort. Typically the trigger action is also included in the retention action, such that a cohort’s retention is 100% on the day of the trigger action (which we can call Day 0). For a product like Netflix, the retention action used might be continuation of the user’s subscription (which is closer to traditional churn measurement used in SaaS businesses).
Cohort retention metrics are evaluated using an evaluation date — typically the x-axis on a retention curve. This is not an actual date such as “January 1” but “days since trigger action” for each cohort. This can be thought of “how long since registration do we want to compute the retention metric for?” When looking at a given retention data point we need to choose one number such as “13 days since trigger action,” but the evaluation date is typically tracked in terms of a repeating period. We might generate our evaluation date “every day” (we want to look at retention the day after the trigger, two days after, three days after, etc…), or longer periods such as “every seven days,” “or every 28 days.” If not using “every day,” I recommend using a period modulo seven because weekly periods cancel out day-of-week effects. I also recommend indexing the trigger action to Day 0 (instead of Day 1), so that when we look at something like “Day 6” it can be interpreted easily as days since trigger.
The evaluation window tells us how long in a period preceding the evaluation date the user has to do a retention action to be considered “retained” — that is, included in the numerator of the retention metric. This is a critical step that is often not considered in metric design. For example, let’s say we’re looking at an evaluation date of Day 13 after trigger (new registration), and our retention action is an app open. If we use a N-day evaluation window, we look from the evaluation date to the N-1 days preceding the evaluation date and ask if a user had a retention action in that window. If they had at least one, they are considered retained.
For example, say our evaluation window is 7 days, and that we want to look at anevaluation date every 7 days. For a user to be considered retained on the Day 20 evaluation date, if our evaluation window is 7 days, they must have had at least one app open from Day 14 to Day 20, inclusive. If a user is to be considered retained in Day 27, they must have had at least one app open from Day 21 to Day 27, inclusive.
Why do we choose 7 days? Typically we don’t want to use a 0-day evaluation window because it’s more important that a user used the product over a given period rather than on a specific, arbitrary day. For certain products (especially ecommerce), longer windows will make sense, and for certain products aiming for high DAU/MAU or return rates, shorter windows will make sense.
When we visualize retention curves, the evaluation date and evaluation window can be flexible and ideally dynamically responsive to analyst/user inputs. We might choose to look at an evaluation window of 7 days vs. 14 days and see how the retention metric changes. It’s also helpful to align on language: to describe retention as of a particular date (e.g., if a team is setting a goal in OKRs), I like to use the terminology DxLy, meaning Day X Last Y retention, where X is the evaluation date and Y is the evaluation window. So using the term D13L7 retention would refer to measuring retention as of Day 13 after registration, where a retention action must have occurred on Day 13 or the prior 6 days.
Finally, the trigger date grouping is how we choose to group users who did a trigger action into a date-based cohort. “Every week” or “every month” is selected most commonly, e.g. every user who registered in May 2021 becomes part of the same cohort. (Note that on the backend, users could be grouped into daily cohorts but then rolled up into weeks or months as needed in reporting and business intelligence tools, which should recalculate the retention metric dynamically.) Users would be added to the May 2021 cohort from May 1 through May 31, and once April comes around, the size of the cohort (the retention denominator) is fixed.
With this in mind, let’s look at a retention curve such as the below for an example consumer app.
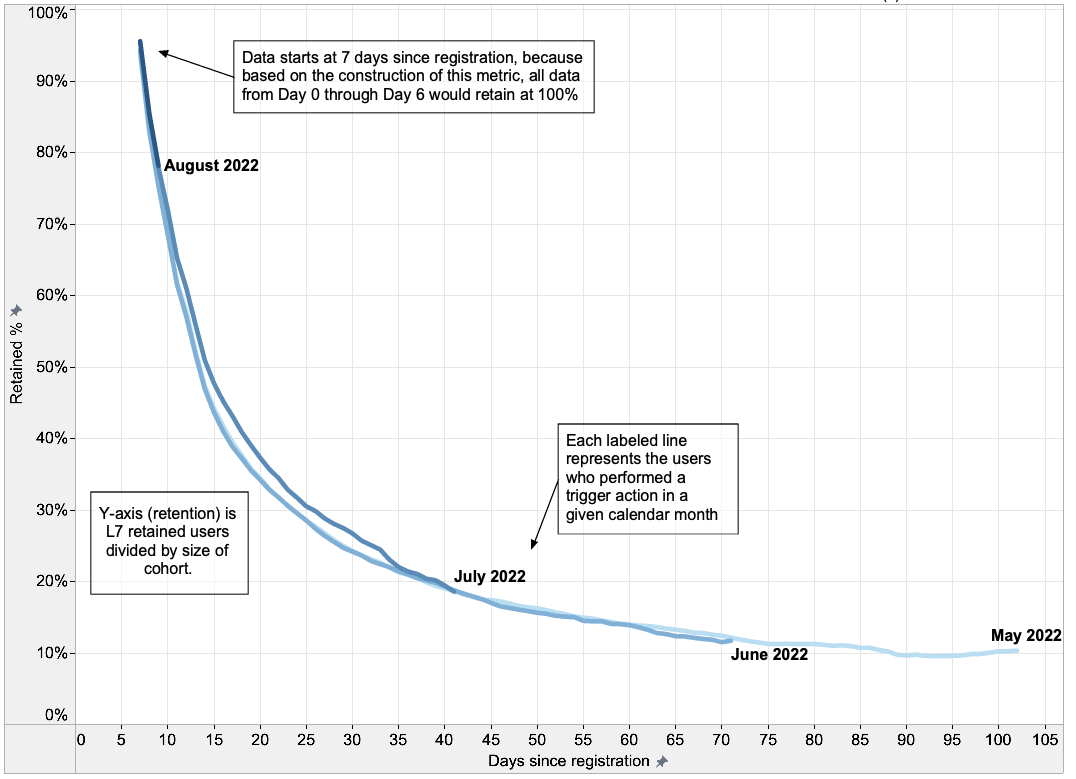
In this case we have:
- The trigger action: registration
- The retention action: app open
- The evaluation date: every day
- The evaluation window: 7 days
- The trigger date grouping: every month
Our y-axis is retention, defined as the number of retained users (who did the retention action in the 7 day window preceding the evaluation date) divided by the number of users in the cohort (who did the trigger action in a given month).
The labeled lines refer to each of four monthly cohorts from May 1 through August 9. Older cohorts have more data points because we have been able to measure those cohorts for longer.
When we look at what we learn from this, we see cohorts appear to perform similarly over these months (there might be minor retention improvement in July), and that the retention curve plateaus around 10%. This plateau can indicate that this product is approaching product-market-fit for this small group, because this group has stopped losing users of the product.
Note that the x-axis of the graph is only populating starting at 7 days after registration. This is because the evaluation window is 7 days: every data point prior to Day 7 would show 100%, based on the parameters above. Accordingly, I’ve excluded those data points from this graph because it adds no additional information to the viewer.
Two final notes:
First, you also need not restrict yourself to one retention metric. Alternative metrics with different trigger actions and retention actions can reveal insights on different areas of the product and business.
Second, I wrote above that users can typically only do a trigger action once, such that each date cohort contains strictly non-overlapping groups of users. What about a product that cares about resurrecting users from dormancy through a new marketing campaign, and wants to track the retention of resurrected users over time? Strictly, nothing about the metric construction requires retention to decrease over time, but if a resurrection campaign is launched at a given point in time, it can be difficult to detect the effects in the retention curves if the users have a different trigger event, like their first registration. To deal with this, you can have a new trigger event such as resurrection, for example: user registration at least 120 days ago and last action at least 60 days ago.